Web App Guide
Location Detail
The full picture for a single paddle spot.
What you'll see
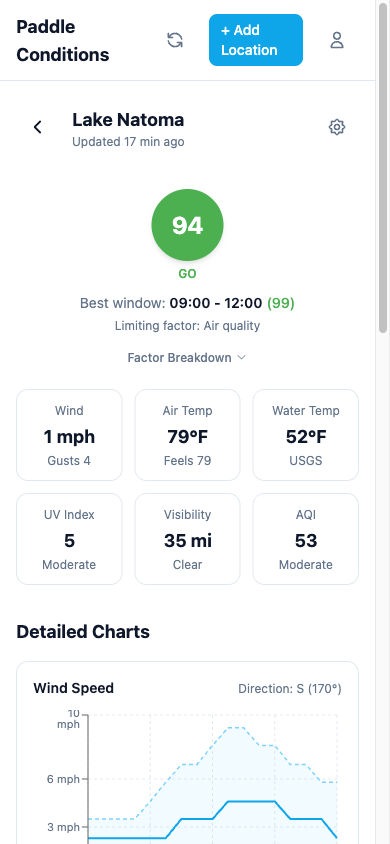
The detail page gives you the full picture for a single location:
- Score and rating with the limiting factor explained in plain language.
- Current conditions grid showing wind, air temp, water temp, UV, visibility, and precipitation.
- Paddle Score chart showing how your overall score trends through the day, with GO and Caution reference lines.
- Hourly forecast charts for wind, temperature, UV, AQI, and precipitation covering the full day.
- Station info showing which monitoring stations are providing water data and their distance from the location.
Paddle Score chart
The first chart on the detail page shows your overall paddle score across the day. Two reference lines mark the GO threshold (80) and the Caution threshold (50), making it easy to spot your best windows at a glance.
Wind chart
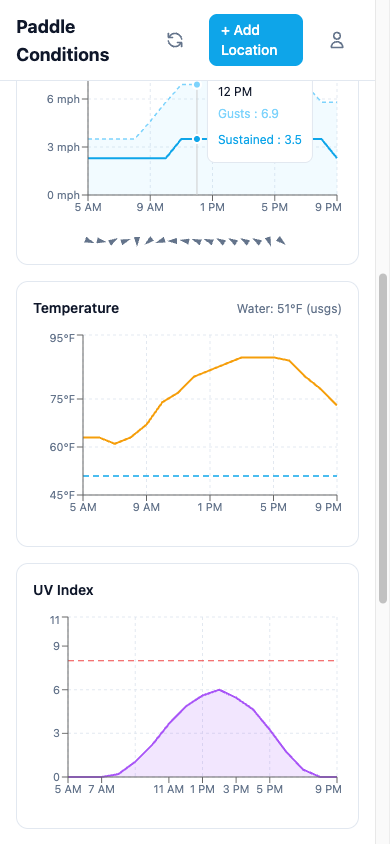
Shows sustained wind speed and gusts throughout the day. A horizontal threshold line marks the wind limit for your activity. The chart uses color coding to highlight periods that exceed comfortable wind levels.
Temperature chart
Displays air temperature across the day. When water temperature data is available from a monitoring station, it appears as a separate line for comparison.
Data sources
Weather data comes from the National Weather Service (primary) supplemented by Open-Meteo for full-day coverage. Water temperature and streamflow come from USGS monitoring stations. Tidal data comes from NOAA CO-OPS stations when available. California water bodies also pull from CDEC (California Data Exchange Center) for water temperature, flow, river stage, reservoir metrics (storage, elevation, inflow, outflow, dam releases), and water quality data.
Charts blend NWS data (most accurate for upcoming hours) with Open-Meteo (provides the full day). NWS data takes priority for hours where both sources have forecasts, giving you the best accuracy for the near future while still showing the complete daily picture.
The data availability list on each location shows exactly which data types are active and which stations they come from.